Components of genetic associations across 2,138 phenotypes in the UK Biobank highlight adipocyte biology

Dec 31, 2019·
Yosuke Tanigawa, Ph.D.
· 2 min read
Image credit: Adobe Stock
Abstract

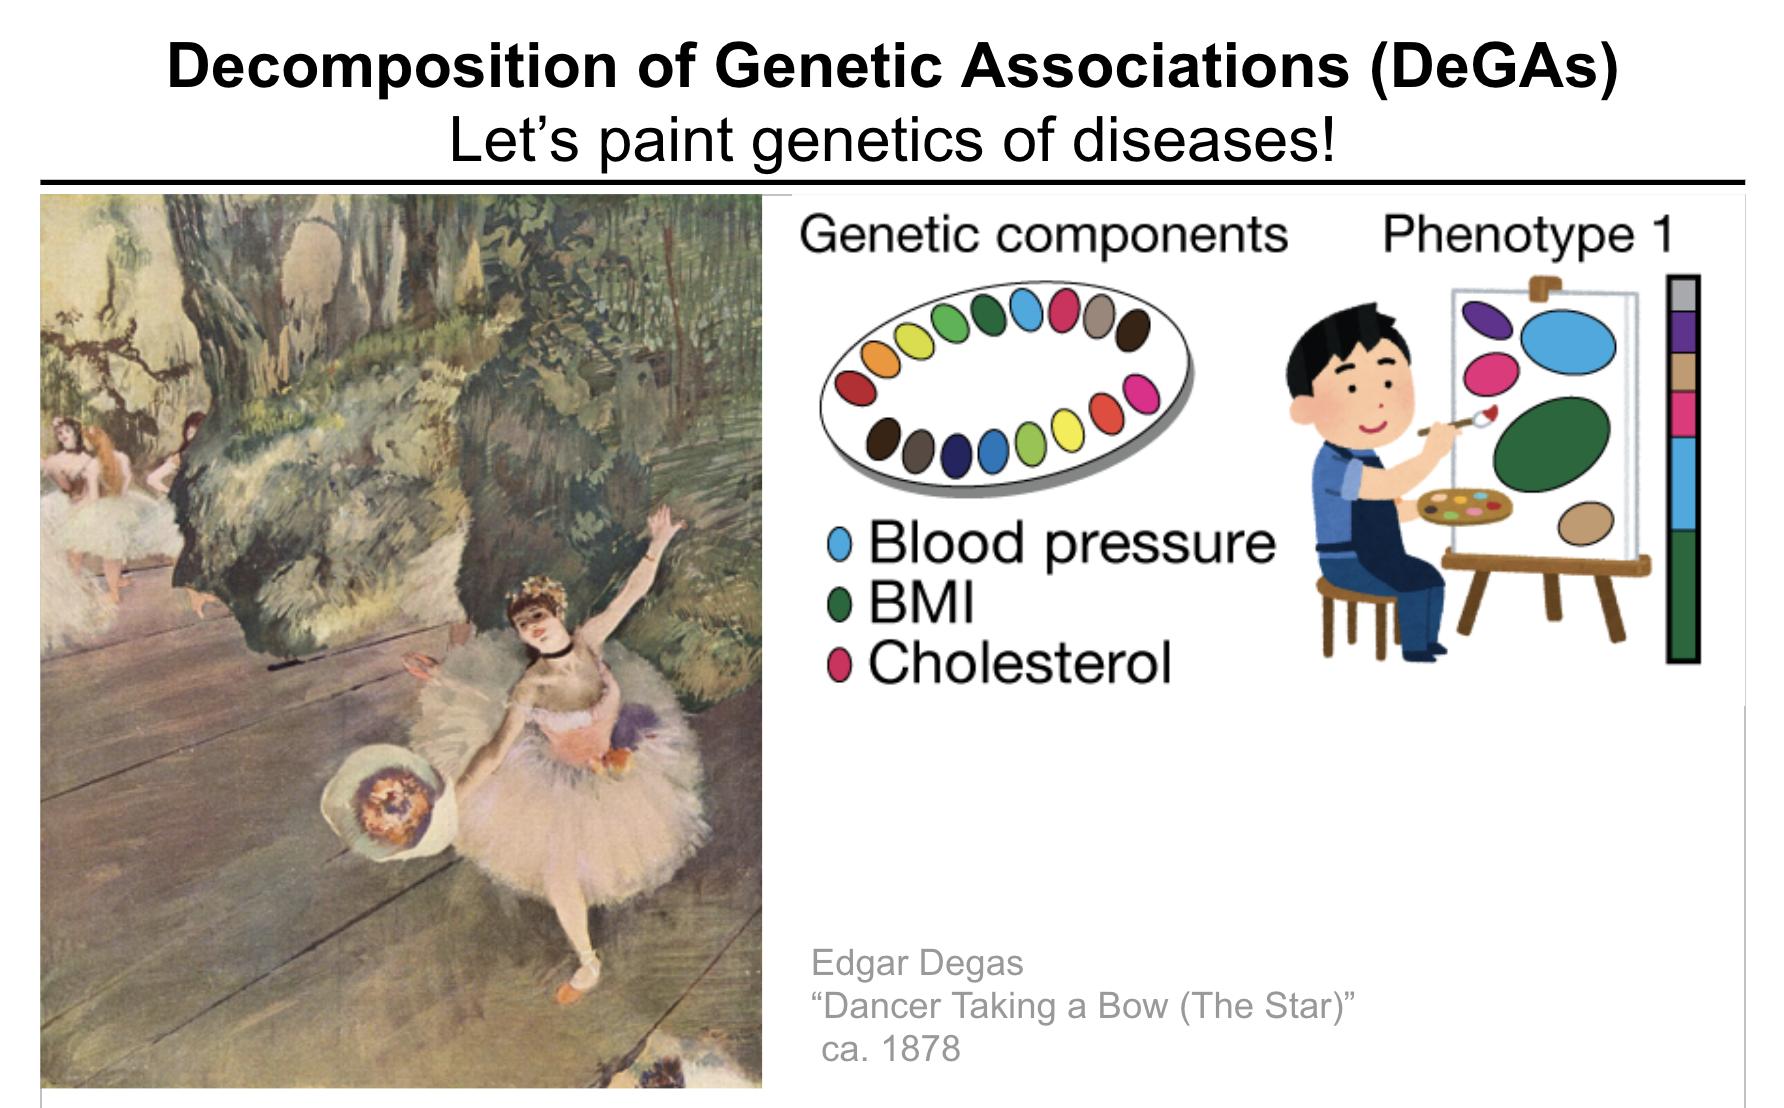
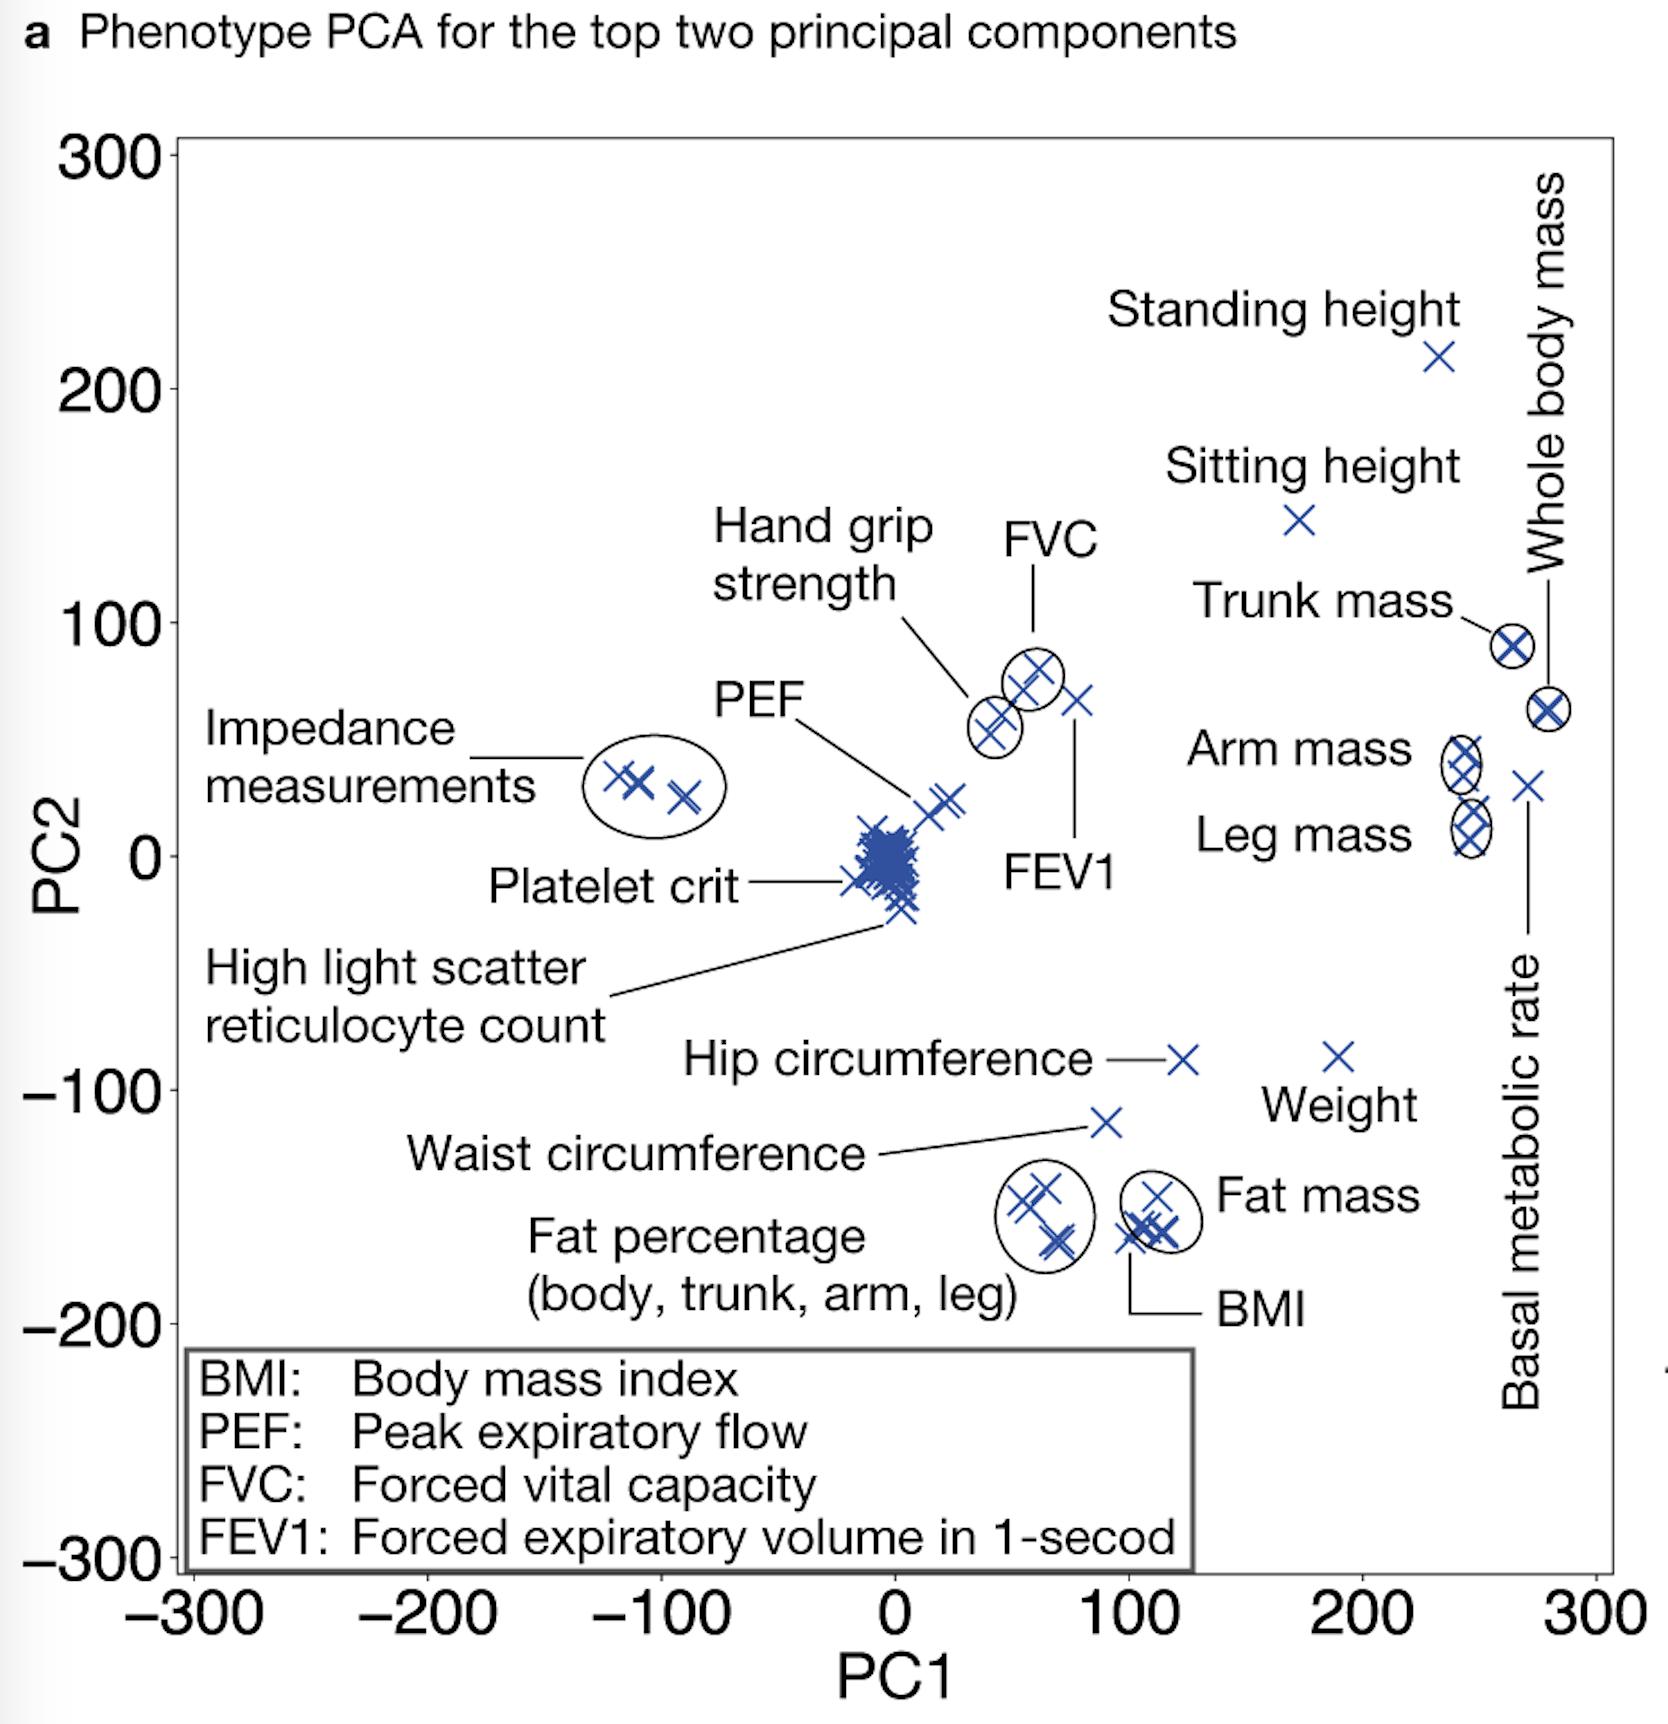
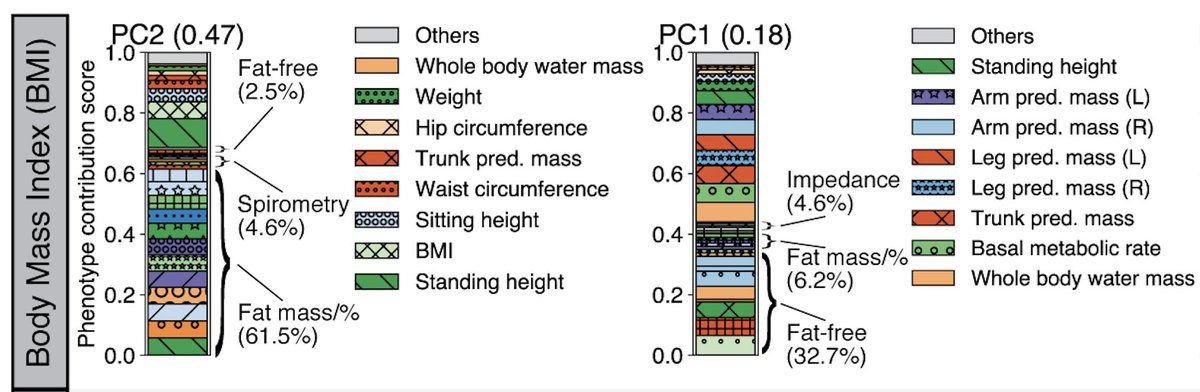
Population-based biobanks with genomic and dense phenotype data provide opportunities for generating effective therapeutic hypotheses and understanding the genomic role in disease predisposition. To characterize latent components of genetic associations, we apply truncated singular value decomposition (DeGAs) to matrices of summary statistics derived from genome-wide association analyses across 2,138 phenotypes measured in 337,199 White British individuals in the UK Biobank study.

Type
Publication
Published in Nature Communications, 2019

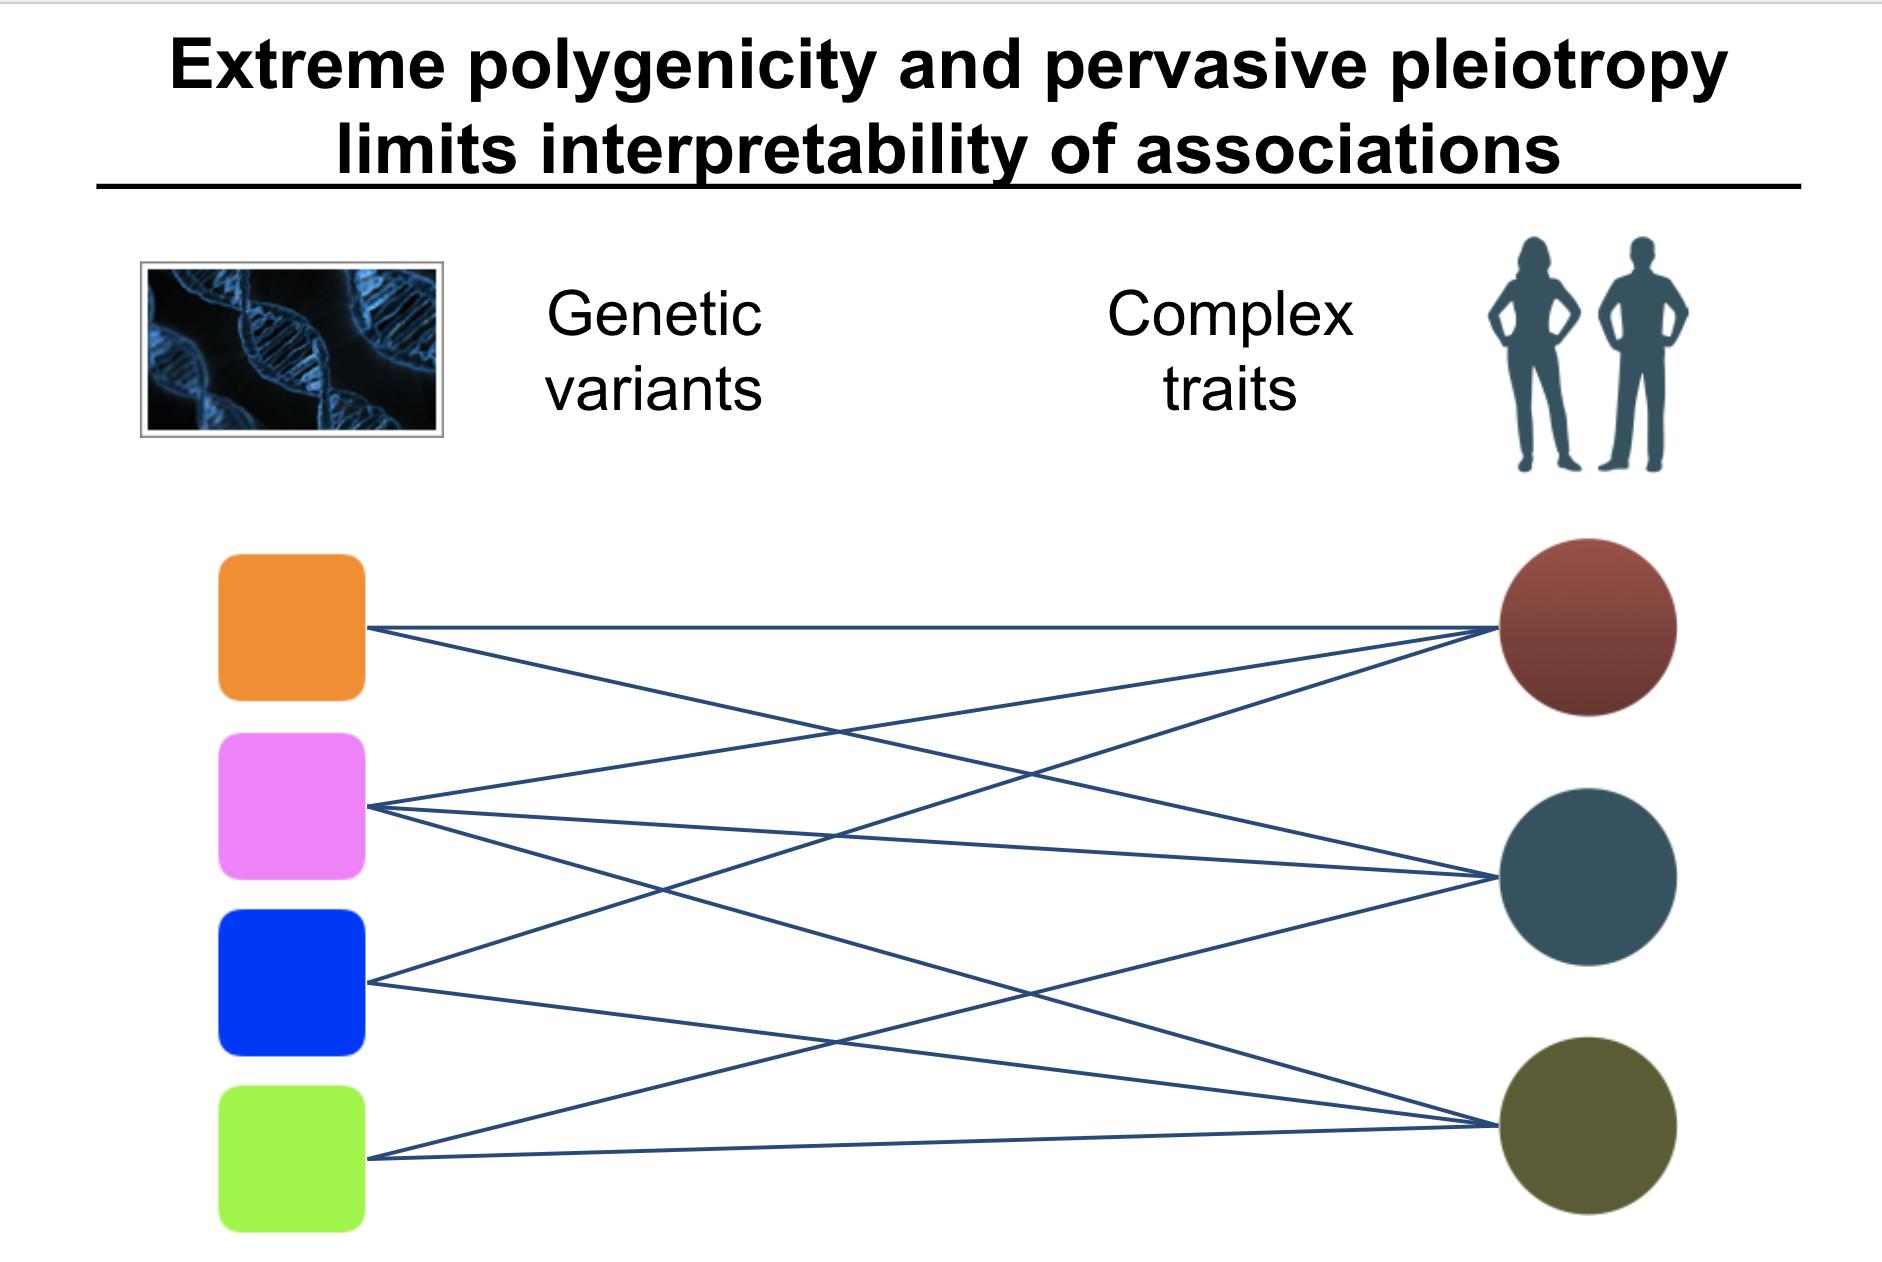
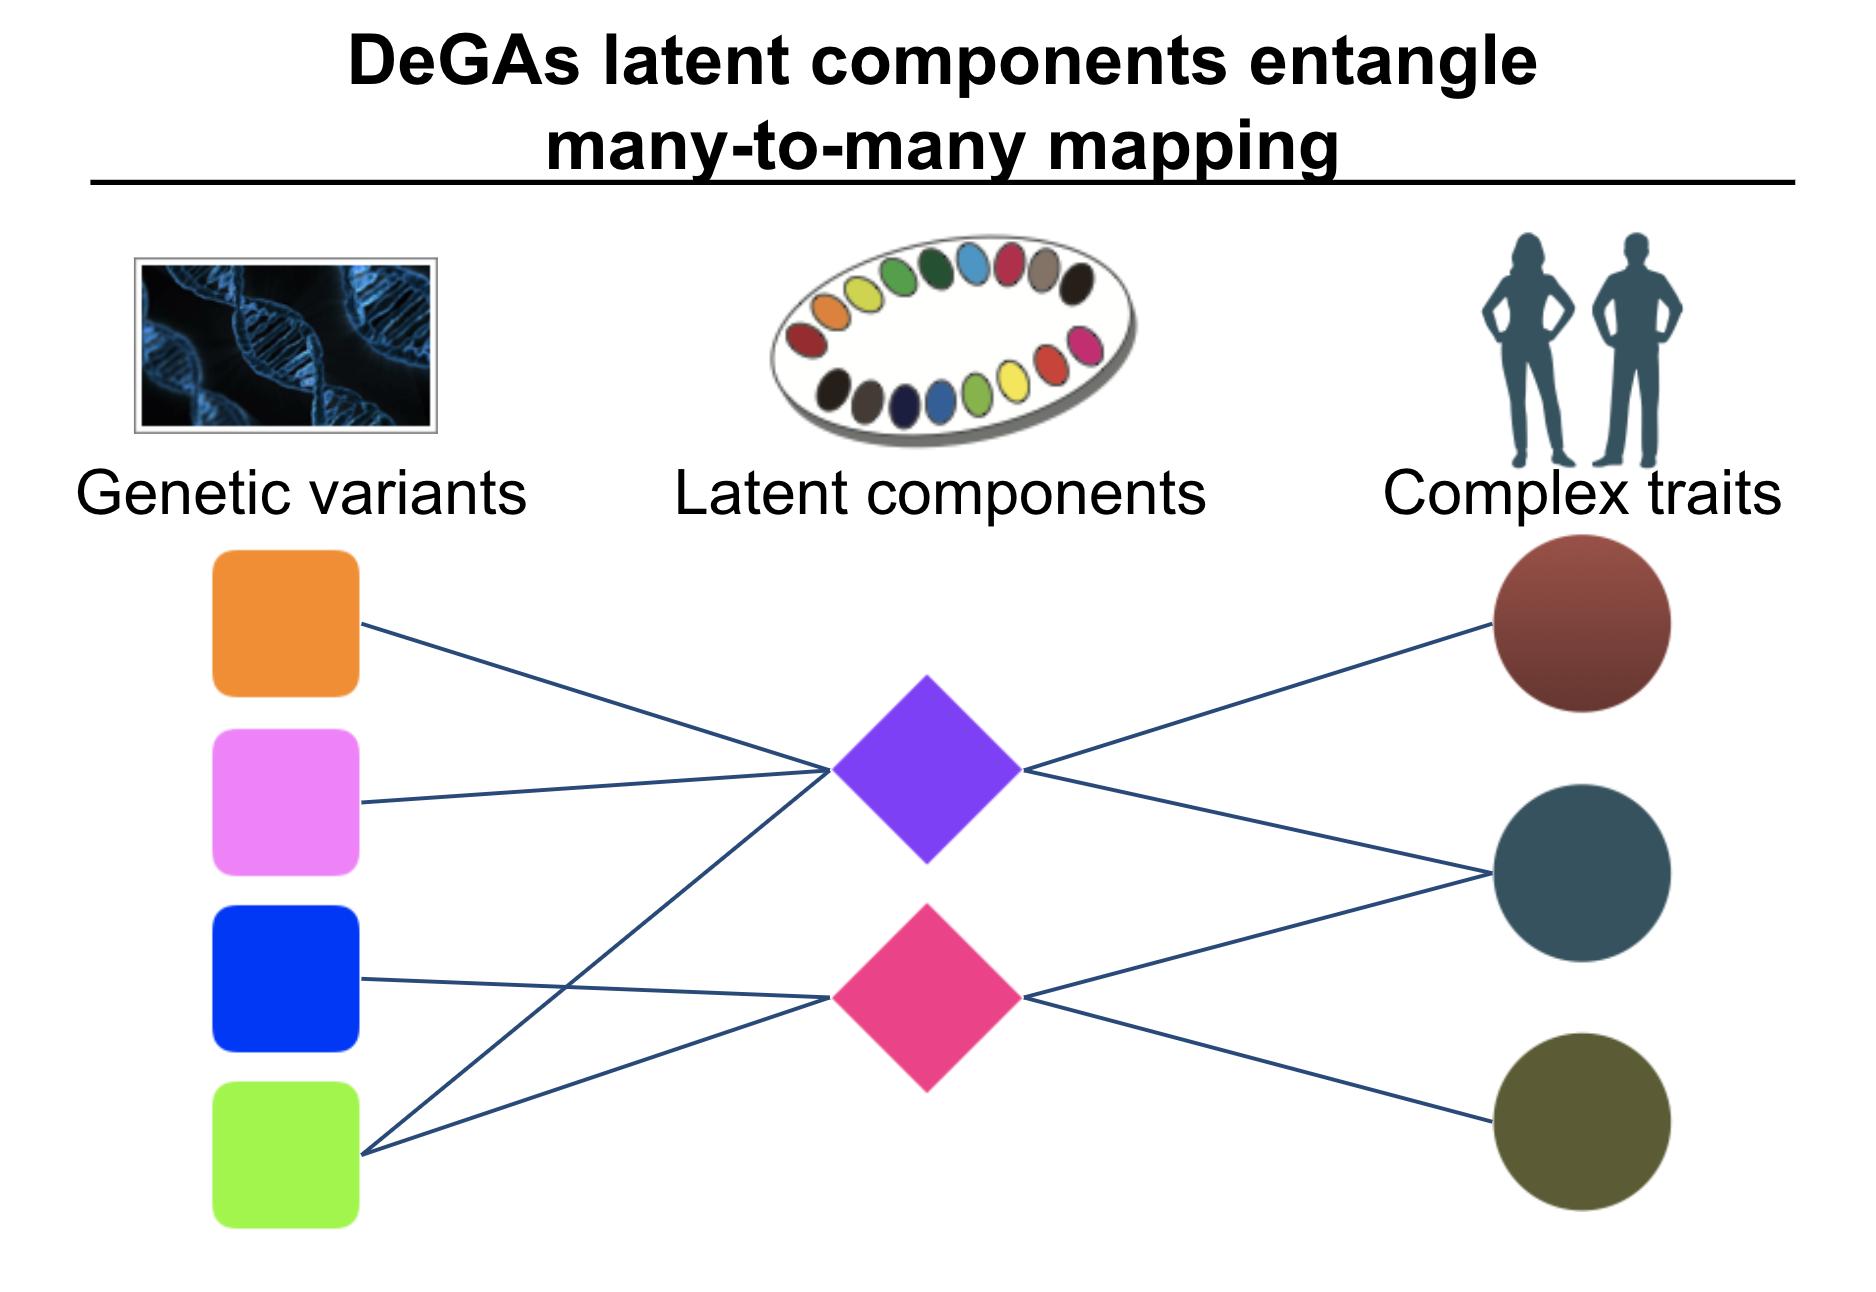
While many pleiotropic genetic loci have been identified, how they contribute to phenotypes across traits and diseases is unclear. We developed DeGAs to address this issue.

DeGAs
When analyzing the genetics of complex traits, extreme polygenicity and pervasive pleiotropy are challenges in the interpretation and translational application of genetic findings.
DeGAs
To address this challenge, we propose to introduce latent components of genetic associations.
DeGAs
In DeGAs (Decomposition of Genetic Associations), we identify latent components of genetic association by applying truncated singular-value decomposition (TSVD) on a matrix consisting of genome-wide association summary statistics computed for thousands of phenotypes. Using those components and our quantitative scores, we represent the genetics of a disease as a mixture of different components. This provides a more interpretable view of disease genetics.
DeGAs
When applied to 2000+ phenotypes in UK Biobank, we found that a related set of phenotypes and variants are captured in DeGAs latent space. For example, standing and sitting heights are in the same direction, even though we applied DeGAs to association summary statistics.
DeGAs
When we look at the top two DeGAs components for body mass index (BMI), the top one (PC2) is mainly driven by fat-related traits, whereas the second most important one (PC1) is mainly driven by fat-free traits, providing an enhanced interpretation of the genetics of BMI.
DeGAs
To prioritize genes for experiments, we applied DeGAs to a subset of the dataset consisting of protein-truncating variants and identified PDE3B and GPR151 as the top two candidates for obesity. Our siRNA knockdown of Gpr151 showed a dramatic decrease in lipids in adipocytes!
DeGAs
Some extensions of DeGAs

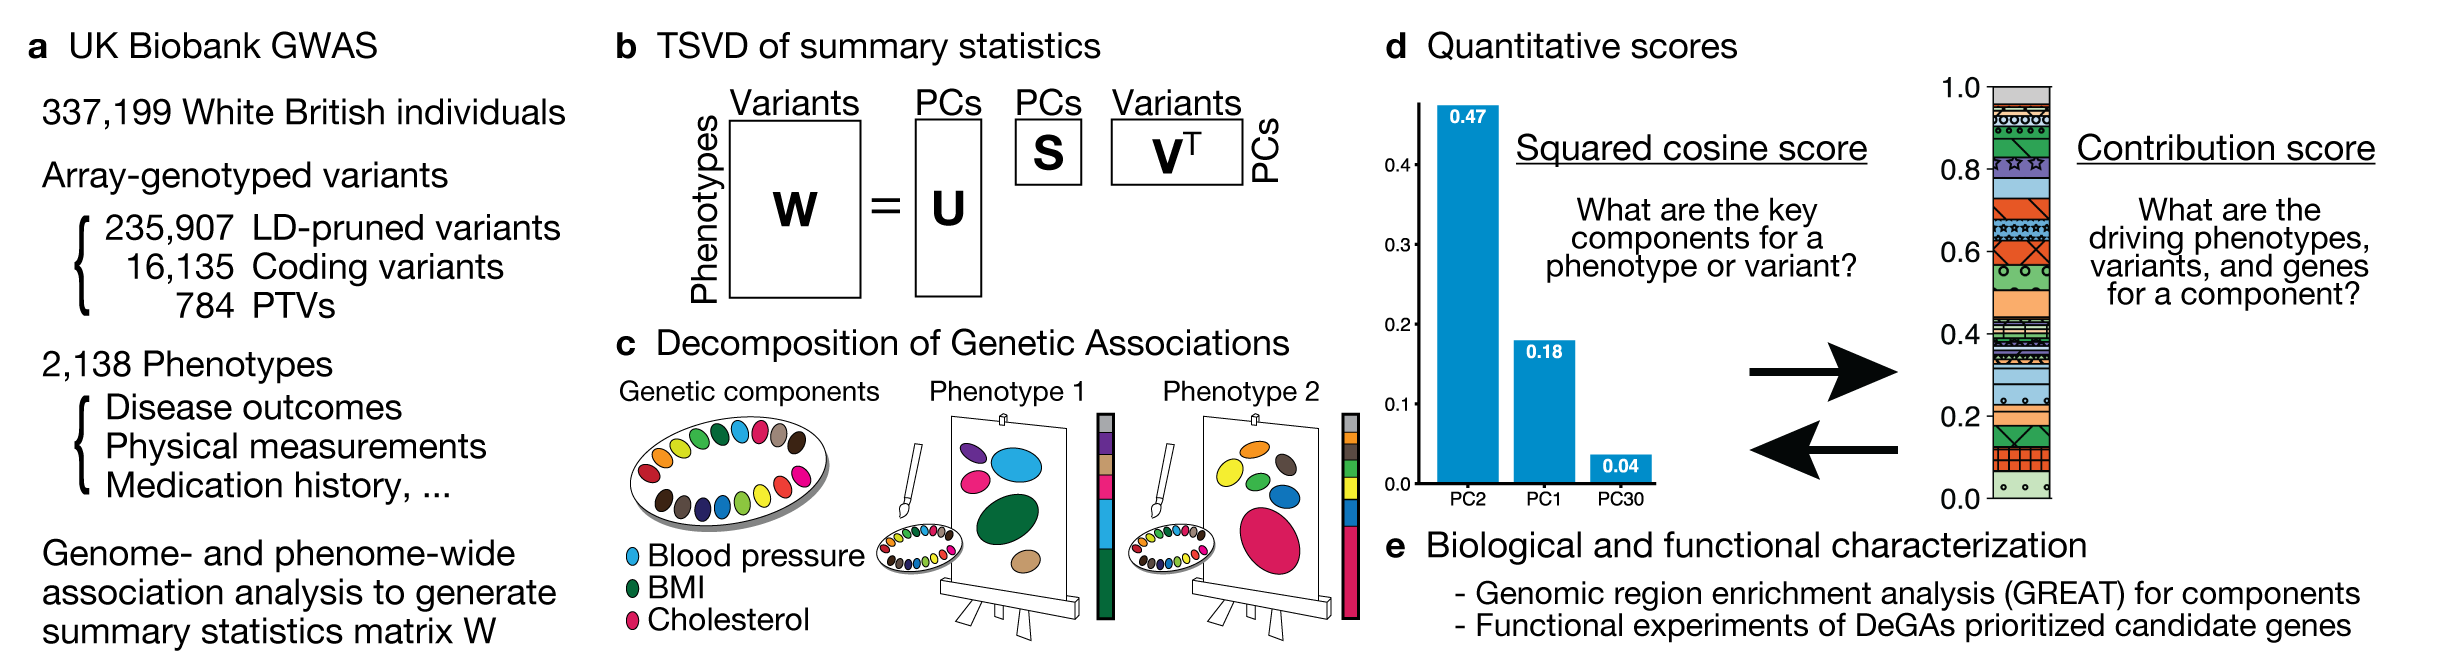
In the Rivas lab, we have several projects that extend the work presented in DeGAs.

  • DeGAs-PRS (dPRS): We propose dPRS, a method to enhance the interpretability of polygenic risk score (PRS) using DeGAs latent components.

  • Sparse reduced-rank regression (SRRR): In DeGAs, we took the summary statistics from univariate association scan across genetic variants and phenotypes. We propose a method to directly fit multi-response sparse regression models.

We provide a resource for the research community. We developed interactive DeGAs web application as a part of Global Biobank Engine, whose video tutorial is shown above.

The datasets used in the study are available from figshare.

Y. Tanigawa, and M. A. Rivas, Decomposed matrices used for the analysis described in ‘Components of genetic associations across 2,138 phenotypes in the UK Biobank highlight adipocyte biology’. https://doi.org/10.35092/yhjc.9202247.v1 (2019).